US Government Revenue
in Recent Decades
Government revenue was badly hit in recent recessions.
Revenue Steadily Increasing
Total government revenue in the United States steadily increased
from $1.3 trillion in the mid 1980s to $3.7 trillion in 2000. But its steady increase
was impacted in the recession of 2000-01 and the Great Recession of 2008-09.
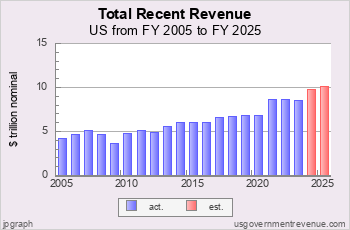
Chart 3.11: Government Revenue in dollars
Total government revenue — federal, state, and local — amounted to $1.3 trillion in the mid 1980s, and then breached
$2 trillion in 1992 just after the recession of 1990-91. In the 1990s revenue increases accelerated, reaching $3.2 trillion in 1998 and reaching a peak of $3.7 trillion in 2000. But in the 2000s, with the dot-com crash and 9/11,
government revenue declined hitting $3.3 trillion in 2002 before resuming its increase again. Revenue reached above $4 trillion in 2005 and $5 trillion in 2007.
Then came the Crash of 2008 and government revenue nose-dived down to $3.6 trillion in 2009. After a few years of catch-up, total government revenue almost hit $6 trillion in 2016.
In 2025 total revenue was estimated at
$10.67 trillion.
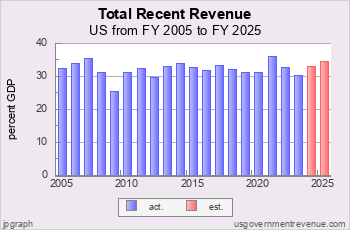
Chart 3.12: Government Revenue as Pct GDP
Viewed as a percent of Gross Domestic Product (GDP) total government revenue in recent years has
fluctuated. Starting at 31 percent of GDP in 1985, revenue increased slightly to 32 percent of GDP through the mid 1990s.
Then revenue began an increase in the boom of the late 1990s, reaching 35.7
percent of GDP in 2000. Revenue retreated to 30 percent of GDP in the trough of the 2000-01 recession, before increasing back to 35.7 percent of GDP at the business cycle peak in 2007.
In the Crash of 2008 government revenue decreased sharply. Revenue declined to 25 percent of GDP in 2009. Total government revenue recovered to 34.6 percent in 2014.
In 2025 total revenue was estimated at
36.4 percent GDP.
Recent Revenue by Government Level
Federal revenue as a percent of GDP has shown a decline in recent decades.
But state and local revenues have increased.
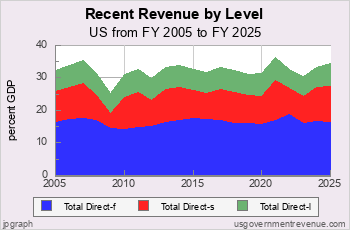
Chart 3.13: Government Revenue by Level
Federal revenue stood at 17.3 percent of GDP in 1990. State government
revenue was 8.5 percent of GDP and local revenue was 6.5 percent of GDP.
By the year 2000 federal revenue had increased to 19.7 percent of GDP, but state revenue
had increased to 9.6 percent of GDP and local revenue had increased to 6.5 percent of GDP.
In the 2000-01 recession federal revenue decreased to 16.9 percent of GDP by 2002, state revenue had decreased sharply to 6.9 percent of GDP and local revenue had decreased
modestly to 6.2 percent of GDP. In the recovery, federal revenue increased to 17.7 percent
of GDP by 2007, state revenue had increased sharply to 10.8 percent of GDP and local
government revenue had increased modestly to 7.1 percent of GDP.
Chart Key:

- Local direct revenue

- State direct revenue

- Federal direct revenue
Then came the Crash of 2008. In 2009 federal revenue dropped to 14.6 percent of GDP,
state revenue collapsed to 4.4 percent of GDP (including $0.5 trillion in employee pension
fund losses) and local revenue decreased to 6.4 percent of GDP. By 2016, federal revenue was
17.5 percent of GDP, state revenue was 8.0 percent of GDP and local revenue was 6.5 percent of GDP.
In 2025 federal revenue was
$5.48 trillion,
state revenue was estimated to be
$3.07 trillion,
and local revenue was estimated to be
$2.11 trillion.
Revenue by Type
Income tax revenue fluctuates; ad-valorem taxes do not.
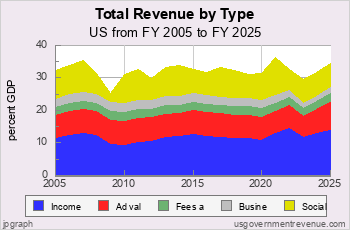
Chart 3.14: Total Recent Revenue by Type
In 1990 income taxes at all levels of government collected 11.5 percent of GDP.
Ad-valorem taxes, such as sales and property taxes, collected 7.4 percent of GDP.
Fees and charges totalled 3.5 percent of GDP and business revenue totaled 1.4 percent of GDP.
Social insurance taxes, including gains and losses on state pension programs, collected 8.4 percent of GDP.
At the top of the business cycle in 2000, income taxes collected 14.2 percent of GDP.
Ad-valorem taxes collected 7.3 percent of GDP.
Fees and charges totalled 2.2 percent of GDP and business revenue totaled 2.7 percent of GDP.
Social insurance taxes collected 9.4 percent of GDP.
At the top of the business cycle in 2007, income taxes collected 13.0 percent of GDP.
Ad-valorem taxes totalled 7.4 percent of GDP.
Fees and charges totalled 2.4 percent of GDP and business revenue totalled 2.8 percent of GDP.
Social insurance taxes amounted to 10.1 percent of GDP.
Chart Key:

- Social insurance taxes

- Business revenue
- Fees & charges
- Ad-valorem taxes
- Income taxes
Two years later in the depths of the Great Recession in 2009
income taxes had declined to 9.5 percent of GDP.
Ad-valorem taxes were almost unchanged at 7.6 percent of GDP.
Fees and charges checked in at 2.7 percent of GDP and business and other revenues at 2.8 percent
of GDP.
Social insurance taxes had decreased to 2.8 percent of GDP. primarily due to $0.5 trillion in losses on government employee pension plans.
In 2016 income taxes amounted to 12.2 percent of GDP.
Social insurance taxes were 7.14 percent of GDP.
Ad-valorem taxes were 7.27 percent of GDP.
Fees and charges were at 2.66 percent of GDP and business revenue at 2.72 percent of GDP.
Revenue Breakdown by Level of Government
The federal government raises revenue principally from income and social insurance taxes. State
government revenue breaks down about equally between income taxes, ad-valorem taxes, and fees and business revenue. Local
government revenue is about half ad-valorem taxes and half fees and business revenue.
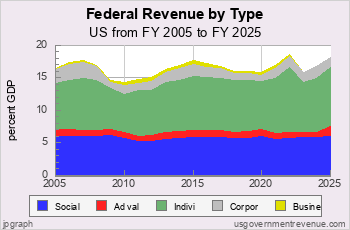
Chart 3.15: Federal Revenue in Recent Decades
In the last 25 years, since the 1990s, federal revenue has come principally from income taxes,
individual and corporate. Individual income tax in 1990 yielded 7.8 percent of GDP and
the corporate income tax yielded 1.6 percent of GDP.
By the top of the late 1990s boom in 2000
the individual income tax was yielding 9.8 percent of GDP and the corporate income tax
was collecting 2.0 percent of GDP. But by the end of the 2000-01 recession in 2004
the individual income tax had collapsed to 6.6 percent of GDP and the corporate income tax
take was cut almost in half to 1.5 percent of GDP.
At the top of the mid 2000s boom the individual
income tax collections had increased by 2007 to 8.0 percent of GDP and the corporate income
tax had increased to 2.6 percent of GDP. In 2010 in the depths of the Great Recession the
individual income tax collected 6.0 percent of GDP and the corporate income tax collected
1.3 percent of GDP.
By 2025 federal individual income tax collections had increased to
9.1 percent GDP
and federal corporate income tax collections had decreased to
2.3 percent GDP.
Federal Chart Key:
- Business revenue
- Corporate Income Tax
- Individual Income Tax
- Ad-valorem Tax
- Social Insurance Tax
The next largest tax source for the federal government comes from social insurance taxes like
the FICA tax on wages. It fluctuates much less than the income tax. In 1990 social
insurance taxes collected 6.4 percent of GDP. In the 1990s boom social insurance taxes collected
between 6.2 and 6.4 percent of GDP. In the 2000s social insurance taxes started out in 2001
at 6.5 percent of GDP then declined to 5.8 percent of GDP in 2010. Social insurance tax collections
dropped to 5.2 percent in 2012 when the federal government cut the FICA tax rate for two years.
Social insurance tax collections increased back to 5.85 percent of GDP in 2015.
Other federal revenue sources amount to about 1 percent of GDP.
As the chart shows, the yield from income taxes fluctuates with the economy, and the
fluctuation has been getting worse with the dot-com recession of 2001-02 and the Great Recession of 2007-09.
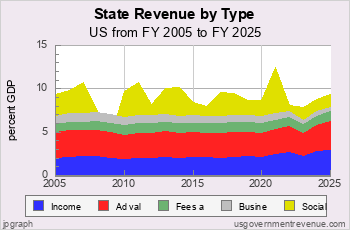
Chart 3.16: State Revenue in Recent Decades
State revenues in the last quarter century have come principally from three sources: income
taxes, ad-valorem taxes such as property and sales taxes, and social insurance taxes. Income taxes
collect about 2 percent of GDP, Ad-valorem taxes yield about 3 percent of GDP, and social insurance
taxes, including contributions to and income from state employee pension programs, have increased from
about 2 percent GDP to 3 percent GDP.
As the chart shows, the revenue from social insurance taxes fluctuates with the economy. This is
primarily driven by capital gains and losses in state employee pension funds. In a good year,
social insurance taxes exceed 3 percent of GDP. In 2009, after the Crash of 2008, social insurance
revenue was -2.7 percent of GDP, due to a loss of $0.5 trillion in state employee pension funds.
State and Local Chart Key:
- Social Insurance Taxes
- Business revenue
- Fees and charges
- Ad-valorem Tax
- Income Taxes
In 2023, the latest reporting year,
state income tax revenue amounted to
2.2 percent GDP,
social insurance taxes amounted to
1.5 percent GDP,
ad-valorem taxes were
2.6 percent GDP,
fees and charges were
1.03 percent GDP, and
business and other revenue were
0.56 percent GDP.
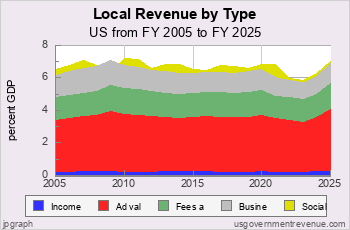
Chart 3.17: Local Revenue in Recent Decades
Local revenues have remained principally ad-valorem taxes, ranging from 3 to 3.7 percent
of GDP. Income taxes remain negligible in most localities. Fees and charges range from 1.3
to 1.6 percent of GDP. Business income, such as utilities and transit agencies, account for revenues ranging from 1.1 to 1.8 percent of GDP. Social insurance revenue, principally from employee retirement funds, fluctuates.
In 2023, the latest reporting year,
local revenues from ad-valorem taxes were
3.05 percent GDP.
Fees and charges amounted to
1.40 percent GDP;
business and other revenue were
1.08 percent GDP.
Social insurance taxes, including gains and losses from government employee pension
plans, were
0.13 percent GDP.


