
|
Revenue Analyses:
Income Tax Analyses:
Numbers — Charts:
| Tweet | | Contact | Follow @chrischantrill |

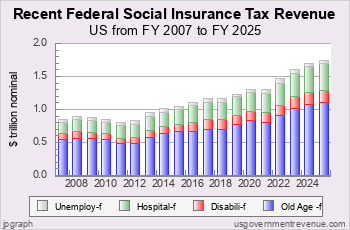
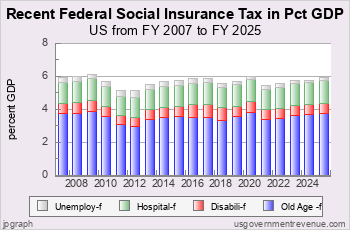
What is the Federal Social Insurance Tax Revenue?
In FY 2025, federal social insurance tax revenue was $1,897 billion according to the Office of Management and Budget. Social Security related taxes amounted to $1,284 billion and Medicare Hospital Insurance Tax was $542 billion.
Budgeted federal social insurance tax revenue for FY 2026 is $1,936 billion.
Federal Social Insurance Tax Analysis
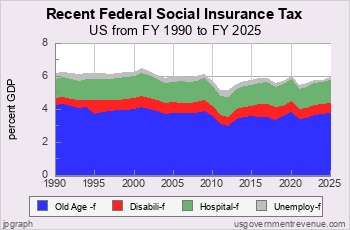
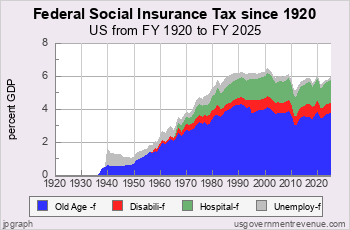
This page shows the current trends in US Federal social insurance tax revenue. There are also charts on US Federal social insurance tax revenue history.
Recent US Federal Social Insurance Tax Revenue
Revenue Analyses:
Income Tax Analyses:
Numbers — Charts:
Suggested Video: Taxes 101
Top Revenue Requests:
Find DEFICIT stats and history.
US BUDGET overview and pie chart.
Find NATIONAL DEBT today.
DOWNLOAD revenue data.
See FEDERAL BUDGET breakdown and estimated vs. actual.
Check INCOME TAX details and history.
See BAR CHARTS of revenue.
Check STATE revenue: CA NY TX FL and compare.
See REVENUE ANALYSIS briefing.
See REVENUE HISTORY briefing.
Take a COURSE at Taxes 101.
Make your own CUSTOM CHART.
Revenue Data Sources
Revenue data is from official government sources.
- Federal revenue data since 1962 comes from the president’s budget.
- All other revenue data comes from the US Census Bureau.
Gross Domestic Product data comes from US Bureau of Economic Analysis and measuringworth.com.
Detailed table of revenue data sources here.
Federal revenue data begins in 1792.
State and local revenue data begins in 1820.
State and local revenue data for individual states begins in 1957.

Site Search
Spending 101
Take a course in government spending:
Spending |
Federal Debt |
Revenue
Defense |
Welfare |
Healthcare |
Education
Debt History |
Entitlements |
Deficits
State Spending |
State Taxes |
State Debt
It’s free!
Win Cash for Bugs
File a valid bug report and get a $5 Amazon Gift Certificate.
Get the Books
 Price: $0.99 Or download for free. |
 From usgovernment spending.com Price: $1.99 |
 Life after liberalism Price: $0.99 Or download for free. |
Data Sources for 2014_2029:
Sources for 2014:
GDP, GO: GDP, GO Sources
Federal: Fed. Budget: Hist. Tables 2.1, 2.4, 2.5, 7.1
State and Local: State and Local Gov. Finances
Sources for 2029:
GDP, GO: GDP, GO Sources
Federal: Fed. Budget: Hist. Tables 2.1, 2.4, 2.5, 7.1
State and Local: State and Local Gov. Finances
'Guesstimated' by projecting the latest change in reported revenue forward to future years
> data sources for other years
> data update schedule.
Blog
Medicaid Update for FY2024
On January 14, 2026, the Centers for Medicare and Medicaid Services (CMS) published its annual report on National Health Expenditures and its NHE Tables includes data on Medicaid from 1960 to 2023. On January 15, 2026, usgovernmentspending.com updated its Medicaid data.
| Item | 2024 Estimate | 2024 Actual |
| Federal Medicaid | $567.2 bn | $567.2 bn |
| State Medicaid (net) | $124.4 bn | $253.2 bn |
| Total Medicaid | $691.6 bn | $820.4 bn |
The federal Medicaid number comes from the Federal Budget Subfunction 558: Grants to states for Medicaid. The state contribution comes from the NHE Tables.
usgovernmentspending.com publishes "guesstimates" of state and local spending from the latest year published by the Census Bureau (currently FY 2023) to the last year in the Historical Tables of the federal budget. (currently 2029 from the FY25 budget). So we have developed "guesstimates" of Medicaid spending going out to 2029, assuming that the overall Medicaid spending increases at the same rate as the federal "Grants to States for Medicaid" increases.
National Health Expenditure data is updated each year in mid December.
On March 27, 2025 the Congressional Budget Office released its annual Long Term Budget Outlook for 2025, which projects federal spendin ...
On November 22, 2025 usgovernmentspending.com updated FY2025 state revenue with quarterly tax data released by the US Ce ...
> blog

usgovernmentrevenue.com
presented by Christopher Chantrill