
|
Revenue Analyses:
Income Tax Analyses:
Numbers — Charts:
| Tweet | | Contact | Follow @chrischantrill |

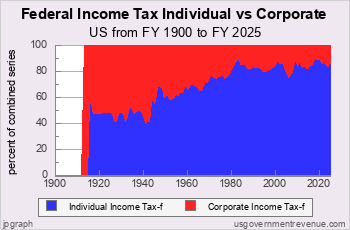
What is the Federal Income Tax Revenue?
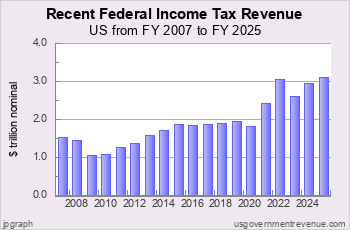
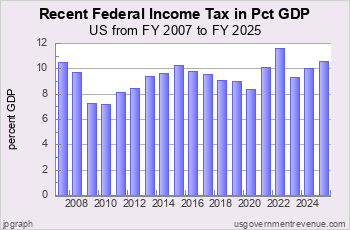
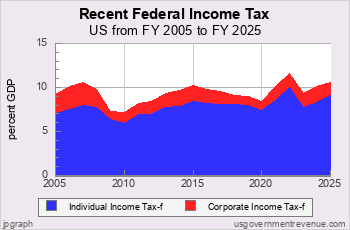
In FY 2025, federal income tax revenue was $3,108 billion according to the Office of Management and Budget. Individual income taxes collected $2,656 billion and corporate income taxes collected $452 billion.
Budgeted federal income tax revenue for FY 2026 is $3,029 billion.
Federal Income Tax Analysis
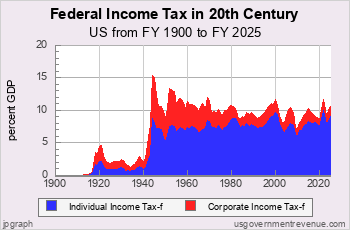
This page shows the current trends in US Federal Income Tax revenue. There are also charts on US Federal Income Tax revenue history.
Recent US Federal Income Tax Revenue
Revenue Analyses:
Income Tax Analyses:
Numbers — Charts:
Federal Income Tax Shares
Income Tax and the Top One Percent
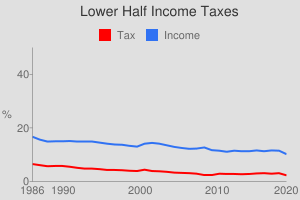
Since the mid-1980s the top one percent of income tax filers has paid an increasing share of federal income tax, except during recessions.

Chart 3.32:
The Top One Percent’s Share
of Federal Income Tax
The top one percent of income tax filers has seen its income increase from 11.3 percent to 22.8 percent of income reported to the IRS in the period from 1986 to 2007. But the share of federal income tax paid has increased from 25.8 percent of all individual income taxes in 1986 to a 40.1 percent share of the total in 2007.
When recessions hit, the rich earn less income and pay a smaller share of taxes. The income of the richest 1 percent dipped from 20.8 percent of reported income in 2000 to 17.5 percent in 2001, while their federal income tax payments dipped from 37.4 percent in 2000 to 33.4 percent in the recession year of 2002.
In the Great Recession of 2007-09, the top one percent share of income fell from 22.8 percent to 17.1 percent of reported income. Their income tax share fell from 40.1 percent to 36.5 percent.
In 2020 the income share of the top one percent was 22.2 percent. Their income tax share was 42.3 percent of total federal income tax collections.
See SOI Tax Stats - Individual Income Tax Rates and Tax Shares, SOI Bulletin article–Individual Income Tax Rates and Tax Shares Table 5 for 1986-2009 and Table 1 for 2001-2018. Descending Percentiles for 2001-2020. Ascending Percentiles for 2001-2020.
Suggested Video: All About Income Tax
Top Revenue Requests:
Find DEFICIT stats and history.
US BUDGET overview and pie chart.
Find NATIONAL DEBT today.
DOWNLOAD revenue data.
See FEDERAL BUDGET breakdown and estimated vs. actual.
Check INCOME TAX details and history.
See BAR CHARTS of revenue.
Check STATE revenue: CA NY TX FL and compare.
See REVENUE ANALYSIS briefing.
See REVENUE HISTORY briefing.
Take a COURSE at Taxes 101.
Make your own CUSTOM CHART.
Revenue Data Sources
Revenue data is from official government sources.
- Federal revenue data since 1962 comes from the president’s budget.
- All other revenue data comes from the US Census Bureau.
Gross Domestic Product data comes from US Bureau of Economic Analysis and measuringworth.com.
Detailed table of revenue data sources here.
Federal revenue data begins in 1792.
State and local revenue data begins in 1820.
State and local revenue data for individual states begins in 1957.

Site Search
Spending 101
Take a course in government spending:
Spending |
Federal Debt |
Revenue
Defense |
Welfare |
Healthcare |
Education
Debt History |
Entitlements |
Deficits
State Spending |
State Taxes |
State Debt
It’s free!
Win Cash for Bugs
File a valid bug report and get a $5 Amazon Gift Certificate.
Get the Books
 Price: $0.99 Or download for free. |
 From usgovernment spending.com Price: $1.99 |
 Life after liberalism Price: $0.99 Or download for free. |
Data Sources for 2014_2031:
Sources for 2014:
GDP, GO: GDP, GO Sources
Federal: Fed. Budget: Hist. Tables 3.2, 5.1, 7.1
State and Local: State and Local Gov. Finances
Sources for 2031:
GDP, GO: GDP, GO Sources
Federal: Fed. Budget: Hist. Tables 3.2, 5.1, 7.1
State and Local: State and Local Gov. Finances
'Guesstimated' by projecting the latest change in reported spending forward to future years
> data sources for other years
> data update schedule.
Blog
Federal Budget for FY27 Released
On April 4, 2026, we updated usgovernmentspending.com with the numbers from the Public Budget Database in the Budget of the United States Government for Fiscal Year 2027.
Here is how headline budget estimates for the upcoming FY 2027 fiscal year have changed since the release of the FY 2025 budget in Winter 2024. There were no budgetary estimates in the budget documents for the FY 2026 budget.
| $ billion | Estimate for 2027 in FY2025 Budget | Estimate for 2027 in FY2027 Budget | Change |
| Federal Outlays | $7,696.6 | $8,092.9 | +$569.1 |
| Federal Receipts | $6,186.2 | $5,921.0 | +$279.1 |
| Federal Deficit | $1,510.3 | $2,171.9 | +$290.0 |
You can see line item changes from budget to budget here. You can compare budget estimates with actuals here.
Account level spending estimates through FY 2031 come from the Outlays table in the Public Budget Database and were updated on usgovernmentspending.com on April 4, 2026.
Account level budget authority estimates through FY 2031 come from the Budget Authority table in the Public Budget Database and were updated on usgovernmentspending.com on April 4, 2026.
On March 15, 2026 usgovernmentspending.com updated its GDP series with the latest data from the Bureau of Economic Analysis ...
On January 21, 2026 the US Census Bureau released its US national and state population estimates for July 1, 2025. On February 7, 2026 usgovernmentspending.com updated its US and state popula ...
> blog
