
|
Revenue Analyses:
Income Tax Analyses:
Numbers — Charts:
| Tweet | | Contact | Follow @chrischantrill |
What is the Total US Government Revenue?
In FY 2026, total US government revenue, federal, state, and local, is “guesstimated” to be $11.78 trillion. Federal revenue is budgeted at $5.48 trillion; state revenue is “guesstimated” at $3.89 trillion; local revenue is “guesstimated” at $2.42 trillion.
a usgovernmentrevenue.com briefing:

Estimated Government Revenue for FY 2026
In 2026 the governments in the United States are expected to collect about
38.6
percent of Gross Domestic Product in revenue. The federal government will collect about
18.0
percent of GDP, the states will collect about
12.8
percent of GDP, and local governments about
7.9
percent of GDP.
Government Revenue: Federal, State, Local
Governments in the US will collect $11.78 trillion in 2026.
In fiscal 2026 the federal government budgets that revenue will be $5.5 trillion. State revenue for 2026 is "guesstimated" by usgovernmentrevenue.com at $3.9 trillion and local government revenue is "guesstimated" by usgovernmentrevenue.com at $2.4 trillion.
Total revenue at all levels of government in the United States is "guesstimated" by usgovernmentrevenue.com to be $11.8 trillion in 2026.
Government Revenue: the Sources
The governments in the US collect about $6.7 trillion a year in income and payroll taxes.
Income tax is where governments collect the most tax: in federal, state, and local income tax they will collect about $3.9 trillion in 2026. Next in line are social insurance taxes, including Social Security, unemployment and hospital taxes, adding up to $2.8 trillion. Ad-valorem taxes, i.e. sales taxes and property taxes, will amount to about $2.7 trillion in 2026. Fees and Charges will add up to $0.8 trillion, and Business and Other Revenue will add up to $0.6 trillion in 2026.
These revenue estimates are based on projections in the federal budget for federal revenue and on "guesstimates" of state and local revenue by usgovernmentrevenue.com.
Pie Chart of Total Government Revenue
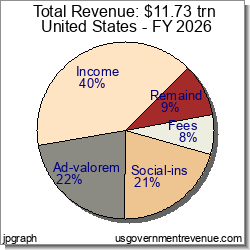
Chart 3.04: Total Revenue Pie
Total government revenue in the United States, including federal, state, and local governments, is expected to total $11.78 trillion in 2026. The total features five major sources. The largest share is income taxes, at 33 percent of total revenue; social insurance at 24 percent of total revenue; ad-valorem taxes, at 23 percent of revenue; fees and charges at 7 percent of total revenue.
Pie Chart of Federal Government Revenue
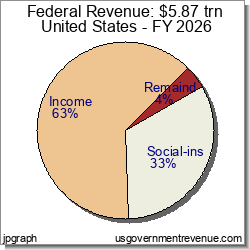
Chart 3.05: Federal Revenue Pie
Federal revenue is budgeted at $5.48 trillion for FY 2026. Almost all revenue comes from income taxes, individual and corporate, at 55 percent of total federal revenue; and social insurance taxes, such as the FICA tax, at 34 percent of total federal revenue.
Pie Chart of State Government Revenue
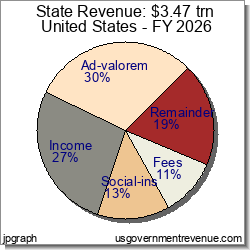
Chart 3.06: State Revenue Pie
State government revenue, as "guesstimated" by usgovernmentrevenue.com, will total about $3.89 trillion in FY 2026, and is balanced between five major sources. The largest revenue source is social insurance taxes, including income from state employee retirement systems, amount to 20 percent of state revenue. Ad-valorem taxes — property and sales taxes — amount to 25 percent of total state revenue. State income taxes are 19 percent of total state revenue. Fees and charges amount to 9 percent of total state revenue.
Pie Chart of Local Government Revenue
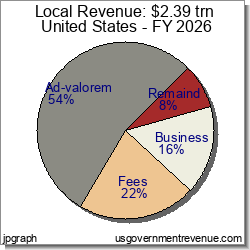
Chart 3.07: Local Revenue Pie
Local government revenue, as "guesstimated" by usgovernmentrevenue.com, will total about $2.42 trillion in FY 2026, and is dominated by ad-valorem taxes — i.e. property and sales taxes — amounting to 49 percent of total local government revenue. Fees and charges amount to 19 percent of local revenue; business revenue, such as utilities and liquor stores, amounts to 17 percent of total local revenue.

Suggested Video: Taxes 101
Top Revenue Requests:
Find DEFICIT stats and history.
US BUDGET overview and pie chart.
Find NATIONAL DEBT today.
DOWNLOAD revenue data.
See FEDERAL BUDGET breakdown and estimated vs. actual.
Check INCOME TAX details and history.
See BAR CHARTS of revenue.
Check STATE revenue: CA NY TX FL and compare.
See REVENUE ANALYSIS briefing.
See REVENUE HISTORY briefing.
Take a COURSE at Taxes 101.
Make your own CUSTOM CHART.
Revenue Data Sources
Revenue data is from official government sources.
- Federal revenue data since 1962 comes from the president’s budget.
- All other revenue data comes from the US Census Bureau.
Gross Domestic Product data comes from US Bureau of Economic Analysis and measuringworth.com.
Detailed table of revenue data sources here.
Federal revenue data begins in 1792.
State and local revenue data begins in 1820.
State and local revenue data for individual states begins in 1957.
Site Search
Spending 101
Take a course in government spending:
Spending |
Federal Debt |
Revenue
Defense |
Welfare |
Healthcare |
Education
Debt History |
Entitlements |
Deficits
State Spending |
State Taxes |
State Debt
It’s free!
Win Cash for Bugs
File a valid bug report and get a $5 Amazon Gift Certificate.
Get the Books
 Price: $0.99 Or download for free. |
 From usgovernment spending.com Price: $1.99 |
 Life after liberalism Price: $0.99 Or download for free. |
Data Sources for 2026:
GDP, GO: GDP, GO Sources
Federal: Fed. Budget: Hist. Tables 3.2, 5.1, 7.1
State and Local: State and Local Gov. Finances
'Guesstimated' by projecting the latest change in reported spending forward to future years
> data sources for other years
> data update schedule.
Blog
State and Local Finances for 2024 -- First Look
On July 2, 2026 we updated the state and local spending and revenue for FY 2024 using the new Census Bureau State and Local Government Finances "first look"summaries for FY 2024 released in April 2026. (See also Annual Survey of State and Local Government Finances). The release includes state and local spending for the United States as a whole. It does not include the 50 individual states and the District of Columbia.
State and local spending and revenue for FY2024 are now actual historical spending as reported by the Census Bureau.
We have updated the "guesstimated" state and local finances for FY2025-31 as indicated in our "guesstimate" blog entries.
Beginning in 2021, the Census Bureau stopped splitting "Public welfare" into three parts:
- Cash assistance payments
- Vendor payments
- Other public welfare
On June 16, 2026, the Center for Medicare Services released its annual ...
On February 25, 2026 the Congressional Budget Office released its annual Long Term Budget Outlook for 2026, which projects ...
> blog
